Bitcoin is at a generational bottom. Here’s why I think so.
Bitcoin is below its 200-week average and further below its power-law trend than at any bottom on record.
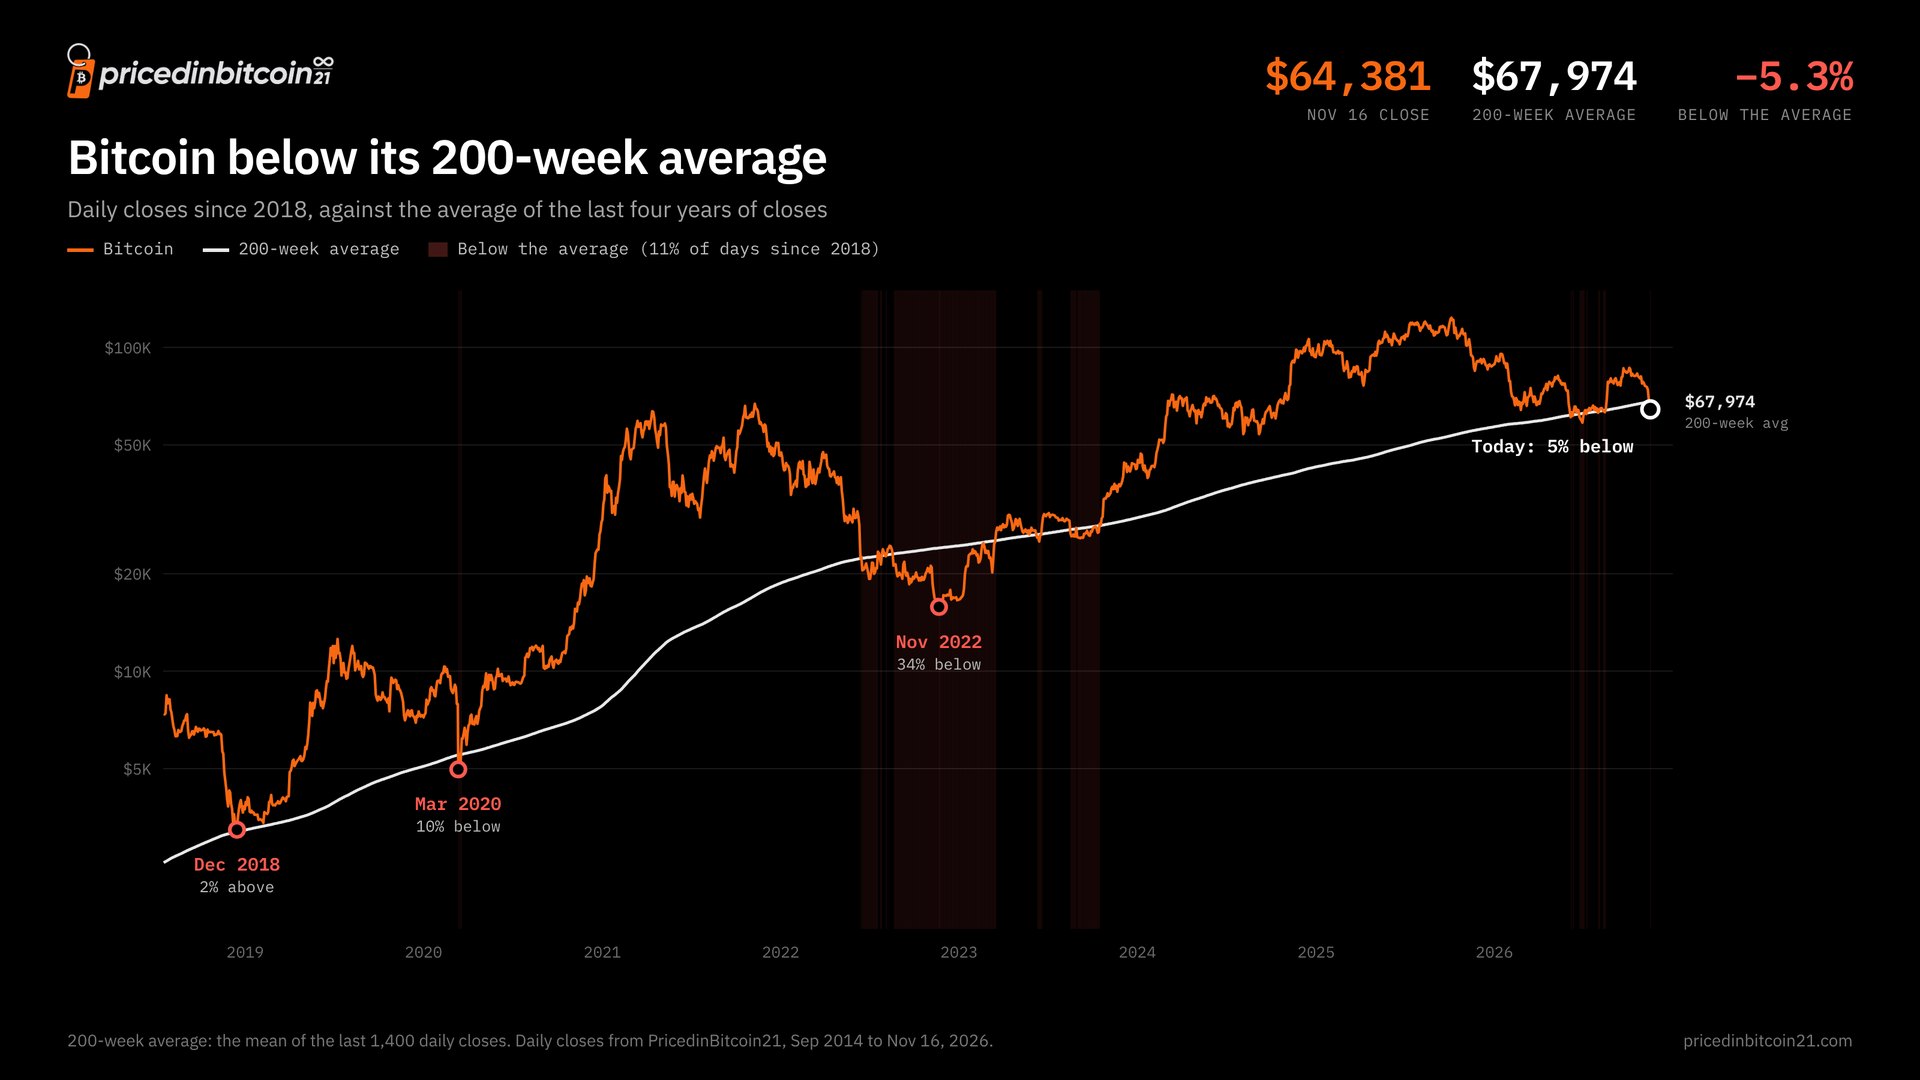
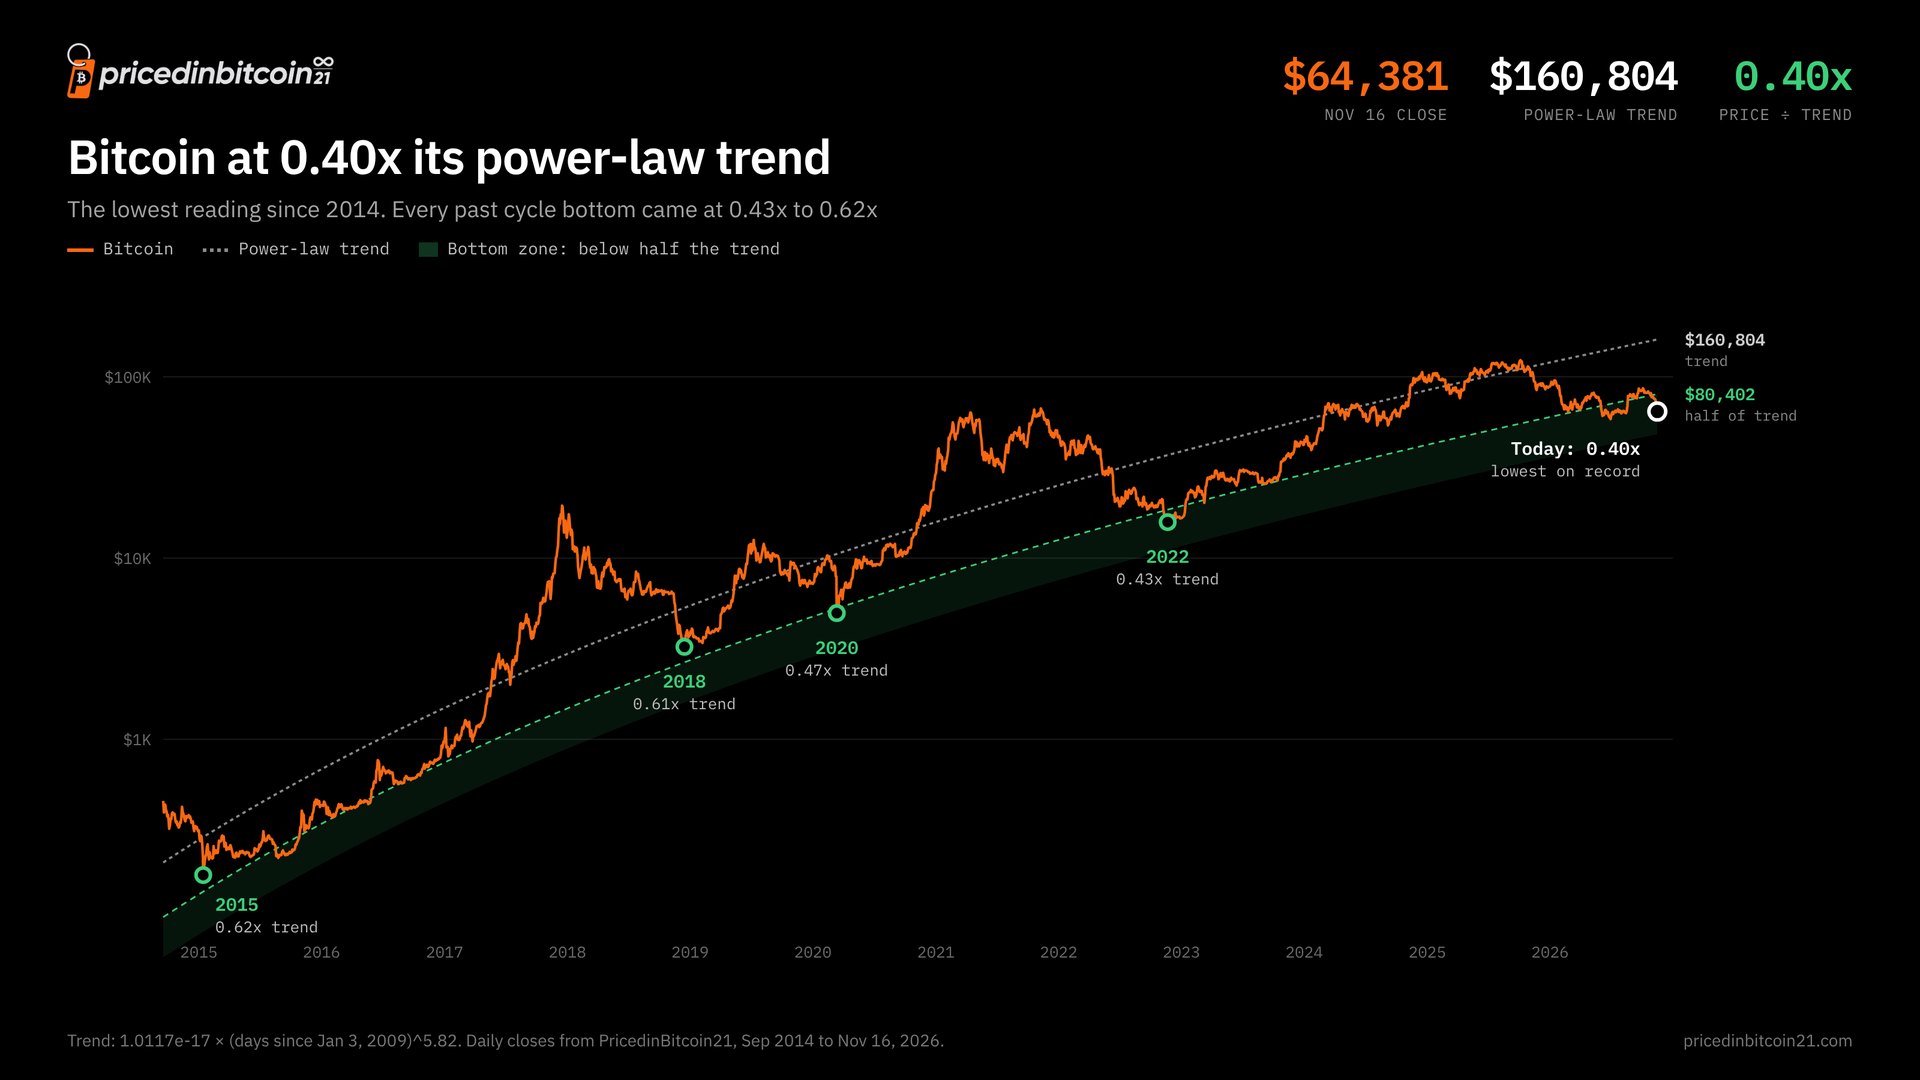
On Nov 16, 2026, bitcoin closed at $64,381: 5% below its 200-week moving average of $67,974, and 0.40 times its power-law trend of about $160,800. That 0.40x is the lowest reading since our data begins in 2014. The 2015, 2018, 2020, and 2022 bottoms came at 0.43x to 0.62x.
I want to go on the record here. I think bitcoin is at a generational bottom.
Why? When I’m looking for a bottom, I don’t care to get fancy. I look at two things: the 200-week moving average and the power law.
Where’s the 200-week moving average?
Bitcoin closed Nov 16 at $64,381. Its 200-week moving average, the average of the last four years of daily closes, was $67,974. In other words, you could buy bitcoin for about 5% less than its average price over the last four years. It slipped below that line on Nov 14. Since 2018, bitcoin has closed below it on about 11% of days.
Here’s where it was at past lows:
- December 2018: right on the line, 2% above.
- March 2020 COVID crash: 10% below.
- November 2022 FTX collapse: 34% below.
2022 is the one worth remembering. Bitcoin first closed below the average on Jun 14, 2022, at about $22,200. It still fell to $15,787 by November. Buying near the 200-week can look good a few years later and feel terrible for months.
Now take a look at the power law
The power law fits a long-term trend to bitcoin’s price based on how old the network is. On PricedinBitcoin21’s version, the trend sits at about $160,800 today. Bitcoin is at 0.40 times that trend, the lowest reading in our data going back to 2014.
Past bottoms, for comparison:
- 2015: 0.62x
- 2018: 0.61x
- 2020: 0.47x
- 2022: 0.43x
Every one of those marked the low of its cycle. Today’s reading is below all of them.
What if you only bought when it was cheap?
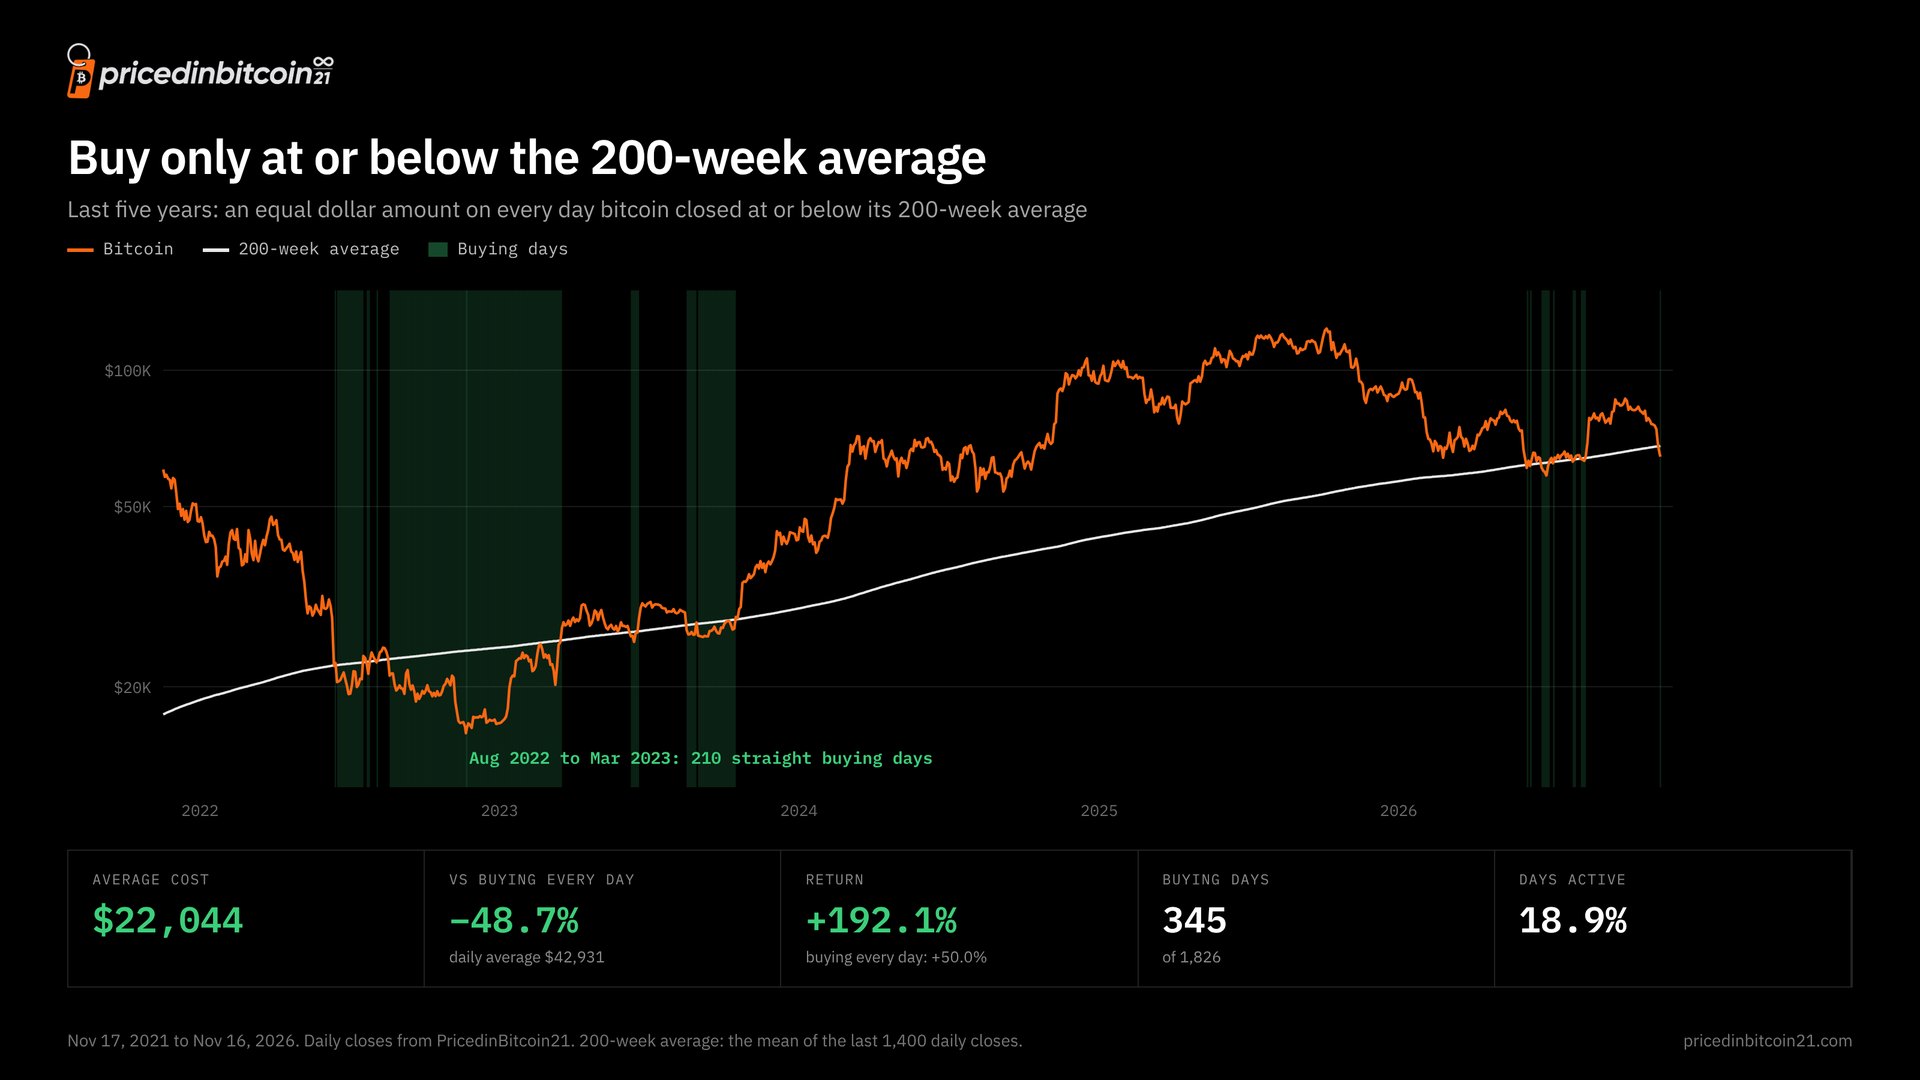
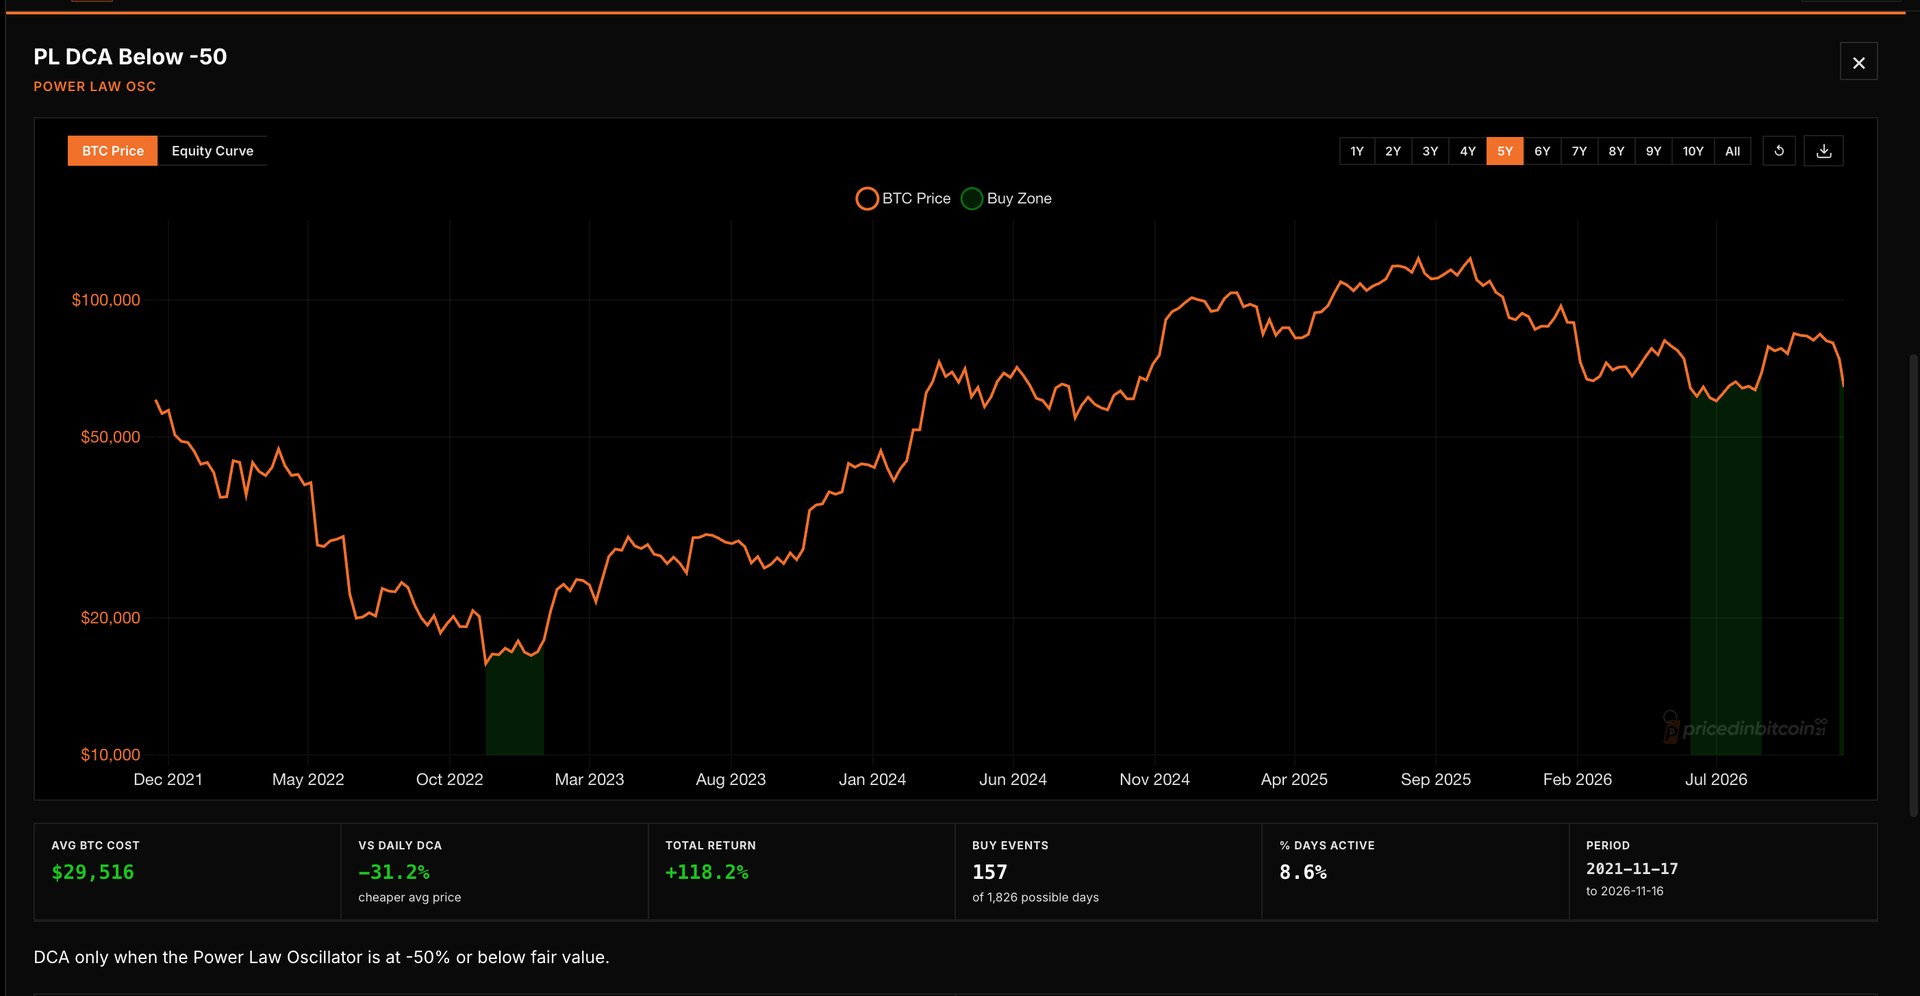
Both lines aren’t only for calling bottoms. They also work as buying rules. Using PricedinBitcoin21’s data, I tested three ways of putting the same dollar amount into bitcoin over the last five years: buy every day, buy only on days at or below the 200-week average, or buy only on days below half the power-law trend.
| Strategy | Buying days | Average cost | vs. buying every day |
|---|---|---|---|
| Buy every day | 1,826 | $42,931 | |
| Only at or below the 200-week average | 345 | $22,044 | 49% cheaper |
| Only below half the power-law trend | 157 | $29,516 | 31% cheaper |
Both rules bought bitcoin for far less than buying every day. Patience did the work: the 200-week rule bought on fewer than one day in five, including a run of 210 straight buying days from August 2022 to March 2023.
One honest caveat: start eight years back instead, and both rules lose to buying every day. In 2019 and 2020, bitcoin was cheap but still above both lines. These rules are for buying fear, not for every market.
So here we are
Bitcoin is below its four-year average and further below its long-term trend than at any bottom on record. Could it go lower? Of course. If I’m looking out four years, I think I’ll care a lot more about whether I bought around $65,000 than whether I caught the lowest print.
Sources: daily bitcoin closes from PricedInBitcoin21, Sep 2014 to Nov 16, 2026. The 200-week average is the mean of the last 1,400 daily closes, so it can be calculated from July 2018. The power-law trend is 1.0117e-17 × (days since Jan 3, 2009)^5.82. Strategy results assume an equal dollar amount each buying day, from Nov 17, 2021 to Nov 16, 2026. This is the author’s opinion, not investment advice.